
Key Points Of This Chapter
For process control, we must first have a deep understanding of the purpose of the product process, including the attributes of raw materials and auxiliary materials, processing unit attributes, and product quality attributes, so as to formulate clear and effective strategies, and finally choose the appropriate method for implementation.
According to ICH Q9 guidance, the quality risk assessment identified fluidized bed granulation as one of the critical unit operations. granules size distribution, density, flowability, compressibility and uniformity are necessary to characterize the final granulation.
For a fluidized bed processor, this will minimally include all temperatures (dew point, inlet, feed and exhaust), process air flow, atomizing air pressure and volume, and spray rate. The dependent variables should also include the pressure difference between the collected material and the outlet filter, and the liquid pipe pressure. In systems with complex air handling units (AHU), total air volume, preheater temperature, ambient air dew point and dehumidification dew point may be added to the list.
This chapter lists the current characterization methods for fluidized bed moisture and granules size. Each method has its own advantages and disadvantages and needs to be configured based on an understanding of the process requirements and purposes.
Chapter 10 Process Control And Process Analysis Technology
01 Background
The development of process control in the chemical and pharmaceutical industries began with simple mechanical temperature and pressure controllers. They were replaced by analog transmitters and controllers – initially pneumatic and later electric. Process computers bring digital control into process plants and serve as open-loop systems primarily for documentation and process optimization. The hardware of the process control system is based on devices equipped with microprocessors, and the control functions are performed by software.
In the product development process, process optimization must first start with the successful development of a stable process, and design of experiments (DoE) provides tools to achieve this goal. Through DoE, key process variables can be identified, and by understanding the experiment, the limiting factors of the scale-up process can be defined. The most important process variables discovered during DoE may still be applicable to pilot scale and eventually commercial batches. Process analysis tools are used to evaluate the stability of experimental results. Variability in raw materials, equipment and processing conditions is inevitable and these variables can affect product quality. An effective strategy design is to develop methods with measurement and control capabilities, as well as methods to compensate for process variability and facilitate continuous process modification.
02 Process Control
In production, it is essential to maintain a high level of automation through integrated feedback loops and to perform process control in real time. PID (Proportional Integral Derivative) controller is a commonly used feedback mechanism in industrial control systems. The PID controller attempts to correct the error between the measured and expected value of the process variable by calculating and utilizing corrective adjustment actions. In a fluidized bed processor, air flow rate and temperature are typical process variables that can be adjusted by a PID controller. If the parameters of the PID controller are not selected properly, the controlled process input may become unstable. Therefore, PID loops should be tuned for each application.
According to the U.S. Food and Drug Administration’s 2004 PAT guidance, the design and optimization of drug formulations and manufacturing processes involves four steps:
(1) Identify and measure critical material and process attributes relevant to product quality.
(2) Design a process measurement system that allows real-time or near-real-time (e.g., on-line, online, or near-line) monitoring of all critical attributes.
(3) Design process controls and provide adjustments to ensure control of all critical attributes.
(4) Develop mathematical relationships between product quality attributes and metrics.
According to ICH Q9 guidance, the quality risk assessment identified fluidized bed granulation as one of the critical unit operations. granules size distribution, density, flowability, compressibility and uniformity are necessary to characterize the final granulation.
Process measurements can be made in one of three ways:
First, samples are taken near the process stream and analyzed;
second, the sample is transferred from the manufacturing process to the analytical instrument and possibly back into the process stream;
Third, a contact or non-contact detector that analyzes the sample while it is part of the process stream.
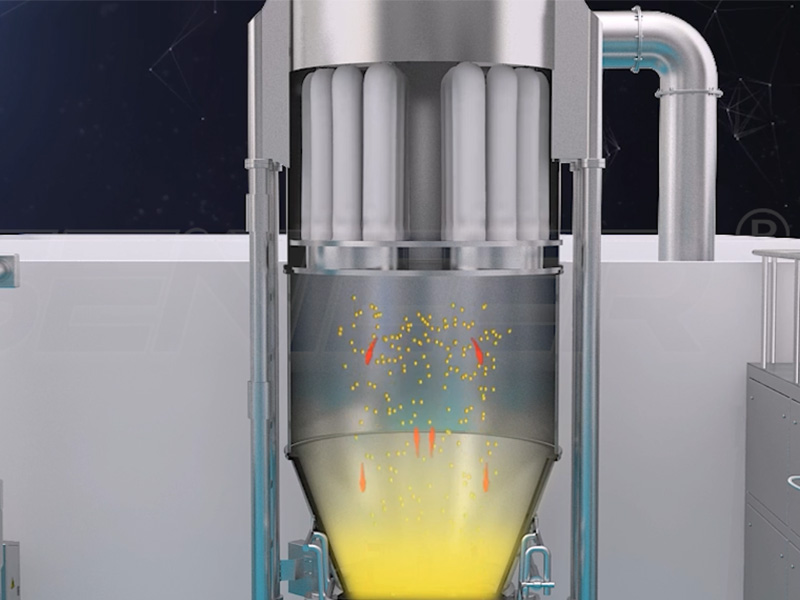
The detection and endpoint of granules growth during fluidized bed processing has traditionally been based on the measurement of process parameters. Formulation ingredients and process control are essential to ensure consistent production of granules with desired quality characteristics. During the liquid spraying process, key data such as inlet air humidity (dew point) and temperature, material and outlet air temperature, air flow, adhesive spray rate, atomization air pressure, bed and filter pressure drop are monitored. During the drying process, inlet air temperature and humidity, material and exhaust temperatures, pressure drop and air flow are continuously monitored. Material and exhaust temperatures indicate constant and declining rates of drying cycles. Process troubleshooting relies on collected data. The type of data and collection intervals vary between vendors and users, but the preference is to collect as much data as possible and as frequently as possible. For a fluidized bed processor, this will minimally include all temperatures (dew point, inlet, feed and exhaust), process air flow, atomizing air pressure and volume, and spray rate. The dependent variables should also include the pressure difference between the collected material and the outlet filter, and the liquid pipe pressure. In systems with complex air handling units (AHU), total air volume, preheater temperature, ambient air dew point and dehumidification dew point may be added to the list.
03 Temperature Measurement
During the granulation process, the material temperature and exhaust temperature are monitored. As the adhesive liquid is sprayed, the material temperature decreases. When the evaporation and spraying of the adhesive liquid reach a perfect balance, the material temperature reaches a stable state. Imbalance will be indicated by observing the material or exhaust temperature.
During the drying phase, the temperature of the material within the bed or the temperature of the air leaving the fluidized bed dryer can be measured. As the water in the granules evaporates, the air and material temperatures are cooled. Therefore, the drying end point can be estimated by the increase in air or material temperature. When the pellets are very wet, the moisture content of the pellets in the bed is estimated from the temperature difference between the dry pellet temperature measured in the bed and the wet pellet temperature of the bed.
If the fluidized bed processor does not have any other instrument to determine the drying end point, establishing a drying curve is another method: when drying enters the critical moisture stage, the material temperature begins to increase. Take a sample from this point every few minutes, measure the drying loss and the corresponding material and exhaust temperatures, establish a correlation, and draw a drying curve. By repeating this process, the exhaust temperature range is determined that is indicative of the required moisture specification of the dry material. This exhaust temperature should be used to determine the end of the drying step.
Another method of temperature-based drying monitoring involves estimating the humidity of the air leaving the fluidized bed by comparing wet and dry granules temperatures. Initially, the humidity of the air leaving the dryer is very high due to evaporation of moisture from the granules during drying. As the granules dry, the humidity of the outlet air decreases; when the humidity of the air inlet and outlet approaches the same value, it is the drying end point. Another disadvantage of temperature-based monitoring methods is the limited accuracy due to poor fluidization conditions within the bed. This method of detecting the end of drying by exhaust or material temperature can only be repeated if the humidity level of the inlet air is controlled.
04 Near Infrared (NIR)
Near-infrared (NIR) spectroscopy has been used to monitor drying, characterizing the degree of dryness by measuring the moisture content of granules within the bed. Near-infrared spectroscopy is an effective alternative to traditional methods because the O-H band of water is very dense in the near-infrared region, exhibiting five absorption maxima, the positions of which depend on hydrogen bond strength. The specific waveband used for water determination depends on the level of sensitivity and selectivity required. In terms of data processing, it is generally easier to quantify moisture content in NIR. granules size measurements in diffuse reflectance mode with near-infrared spectroscopy (NIRs) rely on the granules size scattering effect of the powder, resulting in a nonlinear sloping baseline.
Near-infrared spectroscopy can be used for both quantitative analysis of water and determination of the state of water in solid materials. Frake et al. demonstrated the use of near-infrared for online analysis of moisture content in 0.05-0.07mm granules during spray granulation in a fluidized bed processor. In the fluidized bed granulation process, the occlusion of the measurement window by wet materials poses a challenge to the reliable collection of near-infrared spectra. To minimize interference from wet granules or dry powder, some applications use a purge around the sight glass to eliminate obstructions.
Rantanen et al. describe a method for quantitative measurement of moisture content using 3-4 selected wavelengths. His report noted that a critical part of the online process is the sight glass used for probe positioning, which is constantly blown with heated air. They also reported spectral baselines caused by the granules size and refractive properties of the in-line samples. Solvents other than water were also evaluated for real-time quantification. Accurate near-infrared online granules size analysis is challenging due to variations in the scattering and absorption properties of granules. Nieuwmeyer et al. used near-infrared to determine granules size and drying end point.
05 Chord length Determination (FBRM and SFV)
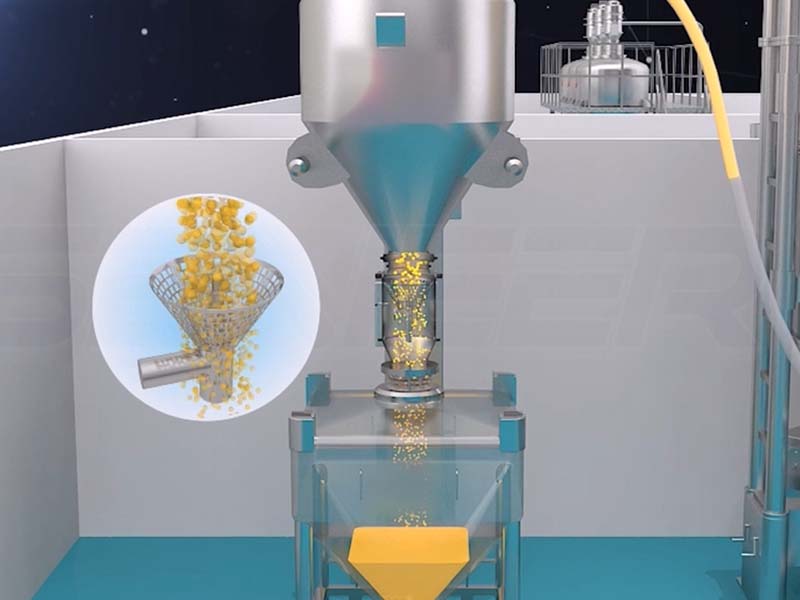
Focused beam reflectometry (FBRM) and spatial filter velocimetry (SFV) (Parsumm-Malvern) are gaining increasing acceptance in the pharmaceutical industry. Both techniques are designed to directly characterize granules size and track changes in granules size and distribution during the process in real time. Although both technologies are laser-based, the measurement principles are different, which results in differences in sampling mechanisms, measurement ranges, sample status/conditions, and application areas.
Focused Beam Reflection Measurement (FBRM)
The FBRM measures the chord length distribution (CLD) and chord number of the granules at every minute interval during the granulation process. The laser beam rotates at high speed (2-8 meters/second). FBRM probes require a rotating laser beam to be focused on granules, which flow in front of the detection window. Laser light is reflected by granules near the probe window, and the reflected light is detected. FBRM can detect three main rate processes (wetting nucleation, consolidation growth, and fracture), but the sensitivity of the optical signal is easily affected by clogging of the probe window. The newly developed FBRM C35 utilizes a mechanical scraper to prevent probe fouling.
Due to this well-known shortcoming of optical in-line probes, an in-line FBRM application has been developed for granules growth studies. Hu et al. studied the chord length distribution (CLD) measured by FBRM to represent the granules size distribution (PSD). The study shows that the chord length trends measured by near-line FBRM technology are consistent with those measured by laser diffractometers and sieve analyzers, although the measurement mechanisms are different. The authors found that near-line FBRM can select appropriate process parameters and effectively control the fluidized bed granulation process. Kukec S et al used FBRM to study the granules growth dynamics during in-situ fluidized bed melt granulation. Furthermore, the usability of these technologies in melt granulation scale-up processes was evaluated. They concluded that near-line measurement technology is a viable tool for process monitoring during transfer of granulation to larger scale or other production sites/equipment. Alshihab et al. studied the effect of probe placement horizontally and at an angle of 45°. They concluded that horizontal mounting resulted in noisy, high scattering and unidentifiable curves in the FBRM process curve due to spray solution sticking and blocking the windows, whereas placing the probe at an inclination of 45° allowed air flux to remove any stickiness. Pellets attached to the window are swept away and remain dry during the granulation process and display a smoother, more reliable curve representing the continuous growth of the granules during the granulation process. Optimization of probe position is critical to maintaining a clear FBRM window and process monitoring.
Spatial Filter Velocimetry (SFV)
Spatial filtered velocimetry (SFV) (Parsum by Malvern) is another method of determining chord length distribution. FBRM uses backscattered laser light to calculate granules chord lengths, and SFV uses the generated shadows to calculate granules chord lengths. During an SFV measurement, granules pass through a laser beam and cast shadows onto a linear array of optical fibers. This creates a burst signal proportional to the granules’s speed. As the granules pass through the beam, a secondary pulse is generated by an optical fiber. In an SFV, the measured granules are dispersed using pressurized air through a measurement zone inside the probe. The speed and chord size of the granules are measured as they pass through the laser beam, thus prohibiting light from entering the detector. Given the speed of the moving granules and the time of the pulse, calculate the chord length of the granules. Using the Parsum probe, as the granules passes through the aperture of the probe tip, the laser-obstructed signal from a single granules can be converted into size information by an extended spatial filter for analysis. To minimize window grime, use pressurized air to disperse the granules. However, the advantage of SFV compared to FBRM is that it can also be easily used as a near-line application without any method development and can therefore be used for granules growth studies in fluidized bed processes.
Närvänen evaluated various on-line and near-line granules size determination methods, including sieve analysis, image analysis, laser diffraction, SFV, and concluded that most of the methods evaluated can be applied in fluidized bed granulation process development. Although there were some challenges in in-line application, the method itself proved to be fast, gave reproducible results, and it was concluded that SFV could be used in process development as a near-line technology.
07 Image Analysis
Characterization Using Image Processing And Analysis Techniques Involves Five Steps:
(1) Image collection,
(2) Preprocessing,
(3) Division,
(4) Extraction,
(5) Representation of characteristic parameters.
One commercially available image analysis technique is QICPIC offered by Sympate, which uses a dispersion system similar to laser diffraction. The basic concept is to combine a powerful diffuser with Dynamic Image Analysis (DIA). A well-dispersed granules stream is directed through the imaging plane. Due to the dispersion effect, the granules are separated from each other by the conveying fluid, and granules overlap is widely avoided. Therefore, high granules numbers can be captured per image frame. Using image processing techniques, the mass median size and shape factor of the granules can be determined.
08 Other Methods
Acoustic emission, Raman spectroscopy, artificial neural networks (ANN), and fuzzy logic are methods that have been used by some researchers, and readers are advised to consult a large number of published theories and applications.
09 Summary
In addition to PAT technical and scientific knowledge, formal experimental designs can demonstrate further understanding of product performance across a wide range of material properties, processing options and processing parameters. It is important to identify parameters that can be changed to describe the response that affects the process. Risk assessments may yield this type of information. Applications of DoE are screening and optimization studies that can ultimately identify the optimal process area (design space), stability testing and Mechanistic modeling. Control strategies ensure that the operation of the process remains within the design space. To optimize the fluidized bed process, the design space along with appropriate control strategies will reduce final product testing while improving process performance and stability.
With the various PAT options available, process control will help define a stable and superior process. The choice of the various methods discussed will depend on the importance of the desired results, and the ability of the technology to deliver the expected results for a given process.